
Rating 10/10: Top rankings for InfoZoom in BARC’s The BI & Analytics Survey 22

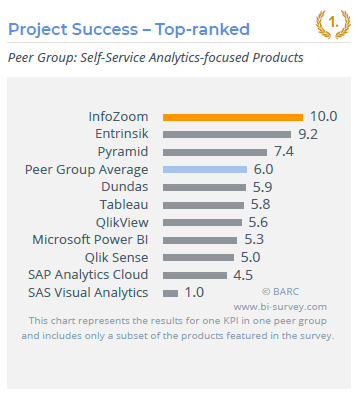
*Graphics using the example of the Peer Group Self-Service Analytics-focused Products
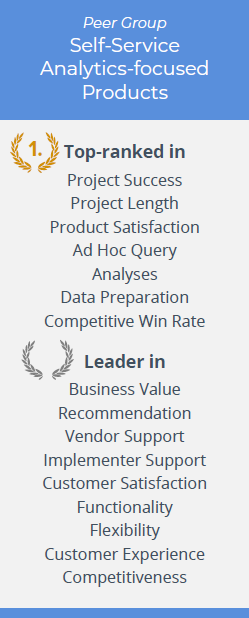
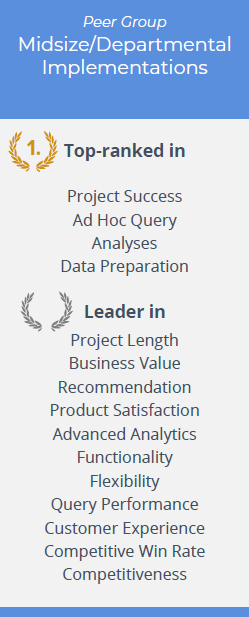
humanIT InfoZoom not only tops all three of its peer groups in the Project Success KPI, but it is the top-ranked product in The BI & Analytics Survey as a whole this year. We measure Project Success by asking customers to evaluate four different aspects of their project implementations: ‘User satisfaction with the implementation’, ‘satisfaction of administrators with the technical implementation’, ‘completion within the budget originally set’ and ‘completion within the timeframe originally specified’.
*Graphics using the example of the Peer Group Self-Service Analytics-focused Products
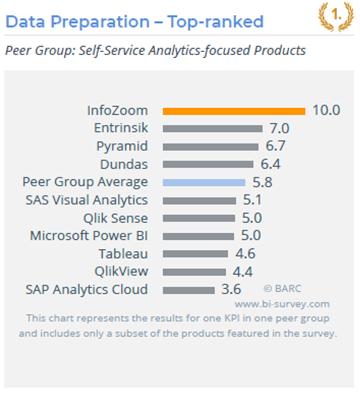
InfoZoom is the highest ranked product for Data Preparation in The BI & Analytics Survey 22. Data preparation encompasses cleaning, structuring and enriching data for use in analytics. InfoZoom assists business users in this process by reading data into its in-memory-based solution and combining the contents of attributes in a row in a meaningful way. Users can immediately form an impression of the correctness of the data. Incorrect values can be identified and adjusted directly by simply editing the values.

*Graphics using the example of the Peer Group Self-Service Analytics-focused Products
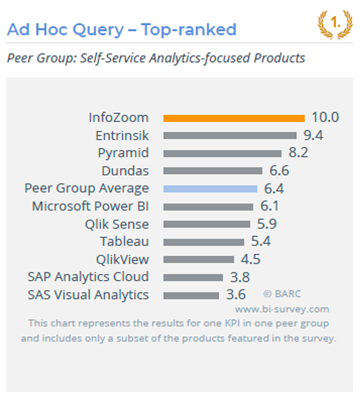
Flexibility in data retrieval and analysis is getting more and more important as companies have to react ever faster to data. Answering ad hoc questions by querying data provides businesses with actionable insights. 77 percent of InfoZoom users rated its ad hoc query capabilities as “excellent” and 23 percent as “good”, making it the number one product for Ad Hoc Query in The BI & Analytics Survey 22. This is a very impressive result which underlines the high value the product seems to deliver to its customers.
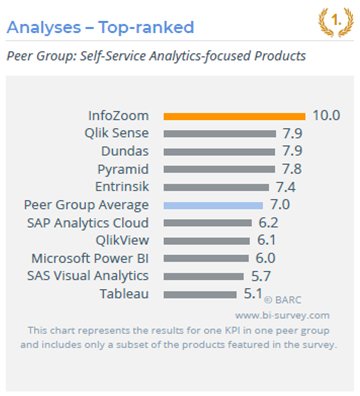
*Graphics using the example of the Peer Group Self-Service Analytics-focused Products
This KPI is based on how users rate their BI tool for performing analyses (KPI calculations, data navigation, predefined analyses). Ad hoc query and analysis are closely related and often used in the same data retrieval, preparation and analysis flow. Therefore, it is not surprising to see InfoZoom topping both the Ad Hoc Query and the Analyses KPIs in The BI & Analytics Survey 22. InfoZoom offers an unique approach to data navigation. Users are presented with a good overview of attributes and their values.
What users say
Very powerful BI software that enables anyone to understand even the largest amounts of data. The support does a super job!
Very good experience. I have done many analyses that would not have been possible with other existing products, or only with enormous effort.
Optimal, I wouldn’t want to do without the tool. It is an important tool in everyday doing.
Use this tool, as there is no quicker way to obtain information about the quality, availability and significance of the data, for example
Enormous flexibility, intuitive operation, answers to questions you haven’t even asked yet.
Rankings in our Peer Groups

InfoZoom is fully in line with the trend with its focus topics – unbeaten in the topic of data quality
For the 5th time in a row, data quality and master data managamenet are the most important BI trends. That shows the current BARC Data, BI & Analytics Trend Monitor 22. InfoZoom is fully in line with the trend with its focus topics – the sotware offers a very unique way to visualize and analyze data. InfoScape – as we call it – is used by business users to zoom in and out of data. By zooming, the user detects interrelationships between different attributes as well as possible anomalies and quality issues in data. It is therefore unsurprising to see InfoZoom being voted the best product in this year’s survey in terms of its contribution to the improvement of data quality.
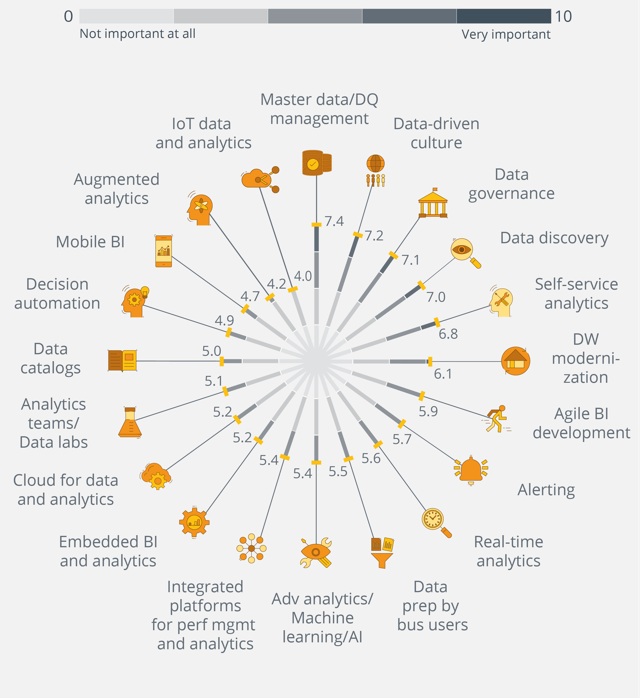
Chart BARC Data, BI & Analytics Trend Monitor
About the Survey
The BI & Analytics Survey 22 is based on findings from the world‘s largest and most comprehensive survey of business intelligence end users, conducted from
March to June 2021. In total, 2,478 business intelligence and analytics end users to the survey with 1,877 answering a series of detailed questions about their use of a named product.
Altogether, 30 products (or groups of products) are analyzed in detail. The BI & Analytics Survey 22 examines user feedback on BI product selection and usage across 36 criteria (KPIs) including Business Benefits, Project Success, Business Value, Recommendation, Customer Satisfaction, Customer Experience, Innovation and Competitiveness.
For more information on the survey, visit The BI Survey website.


