20 Top Rankings in the
BARC BI & Analytics Survey 24
In our 3rd year of participation, we once again achieve top results in the BARC BI & Analytics Survey, the world’s largest annual survey of BI and analytics software users
Highlights at a glance:
- 100% recommendation
All customers who participated in this year’s BARC BI & Analytics Survey would recommend InfoZoom to others - Data Quality Champion
For the 3rd time in a row, we have taken first place when it comes to helping customers improve their data quality. - Excellent project success
For the third year in a row, we achieve excellent results in the KPI “Project Success” and receive 10/10 points in our peer groups. - We keep our promises
Customers praise our sales process because we keep our promises. We are also the best product across the entire survey when it comes to answering questions quickly. - High business value
Customers emphasize that the use of InfoZoom increases employee satisfaction. - 10/10 in the KPI “Analyses & Ad Hoc Query”
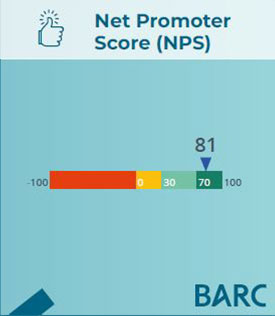
We achieve the highest score in each of our peer groups. This impressively illustrates the versatility of the product. - Net Promoter Score 81
The NPS >80 shows the continuous satisfaction and loyalty of our customers.

WOW, these results are impressive


Consistently in the lead


What users say
This is by far the most stable tool we use, simply top!
The hopes and expectations that my stakeholders and I placed in the product and the
product environment at the time of the decision were completely fulfilled. The product
demonstration in the run-up to the decision was competent, very customer-oriented and
absolutely honest – the presented possibilities of the solution can now be used as we had
hoped and have ultimately resulted in an unexpectedly broad range of uses. Particularly
noteworthy is the increase in data quality in the various source systems – sparked by the
introduction and use of InfoZoom.
Very good tool for checking and improving
data quality.
An indispensable tool for us and our
customers.
The Swiss army knife of BI tools. Universal,
intuitive and powerful.
The transparent view of our data is the
main strength of InfoZoom
Just do it, it‘s worth it. Infozoom does
everything before the dashboard.
The speed of the tool is the key advantage. Results can
be generated quickly, which in turn can be the basis for
important decisions.
More information: https://barc.com/de/reviews/, https://barc.com/de/reviews/data-tools/ and www.bi-survey.com.
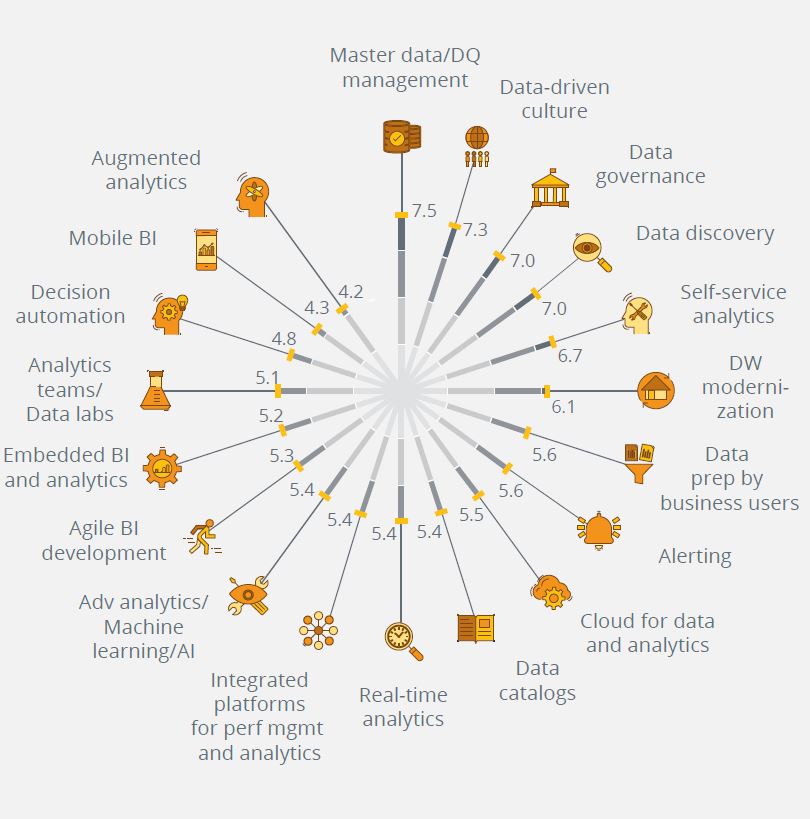
InfoZoom is fully in line with the trend with its focus topics – unbeaten in the topic of data quality
For the 6th time in a row, data quality and master data managamenet are the most important BI trends. That shows the current BARC Data, BI & Analytics Trend Monitor 23. InfoZoom is fully in line with the trend with its focus topics – the sotware offers a very unique way to visualize and analyze data. InfoScape – as we call it – is used by business users to zoom in and out of data. By zooming, the user detects interrelationships between different attributes as well as possible anomalies and quality issues in data. It is therefore unsurprising to see InfoZoom being voted the best product in this year’s survey in terms of its contribution to the improvement of data quality.


