Reports on demand –
just as flexible as the analyses
The flexible reporting options and the focus on quick and reliable answers to spontaneous questions complete our holistic approach. Reports with InfoZoom – you can choose from a variety of options to design the reports just as you need them: internal queries, charts, reporting, numerous export functions, integrated List & Label component, and many more. It’s up to you.

The first step on your way to good reports: a valid data basis
It is not colourful dashboards that make up good reporting, but reliable data. With InfoZoom, you optimally prepare your data for the report as you can find critical data constellations at one glance and correct them just as quickly.
Easy as pie:
spontaneous analyses pave the way to flexible reports
You can easily handle any analyses with InfoZoom, from simple formulas through to complicated questions. Once you are done with the analysis, you can create key performance indicators and reports in next to no time.

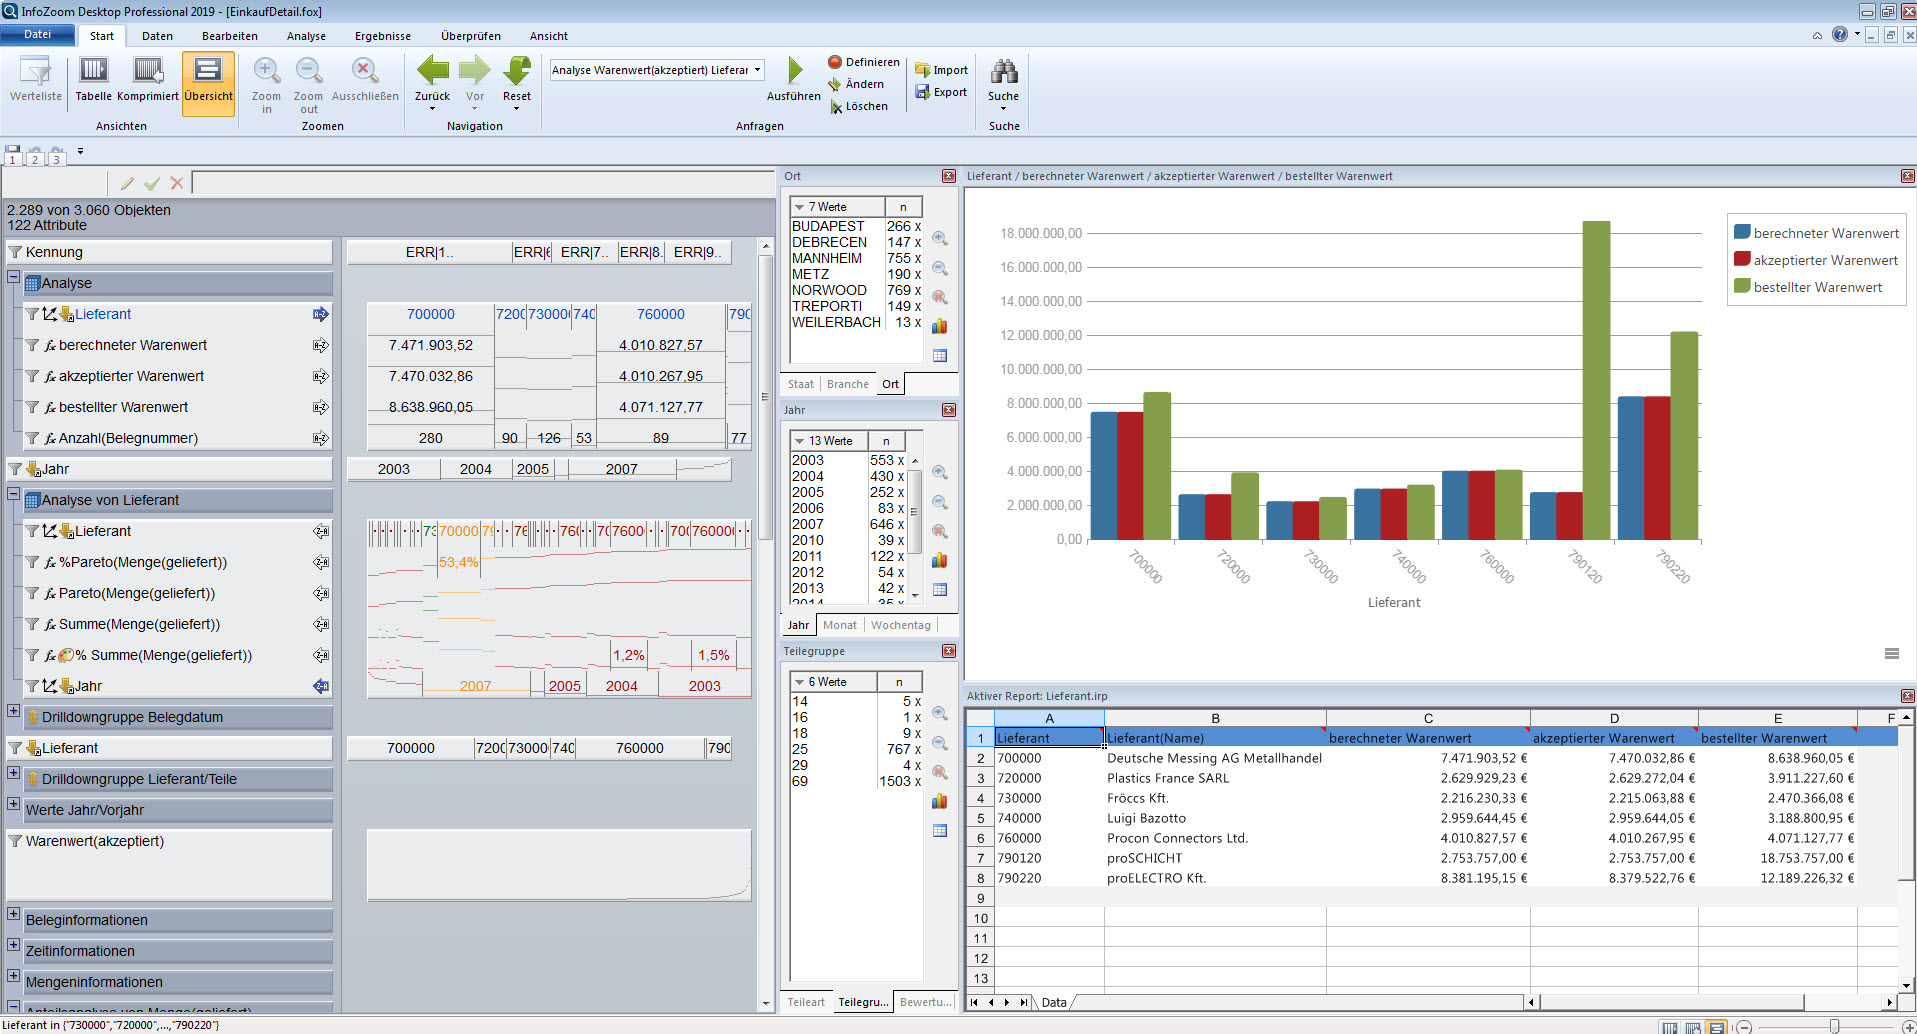
Internal InfoZoom
reports & queries
Charts and reports at the push of a button: InfoZoom features fast reporting tools out of the box. They are adapted immediately when you change the criteria. You can use macros to put queries together to form a dashboard that you can access with just one click.
Export functions –
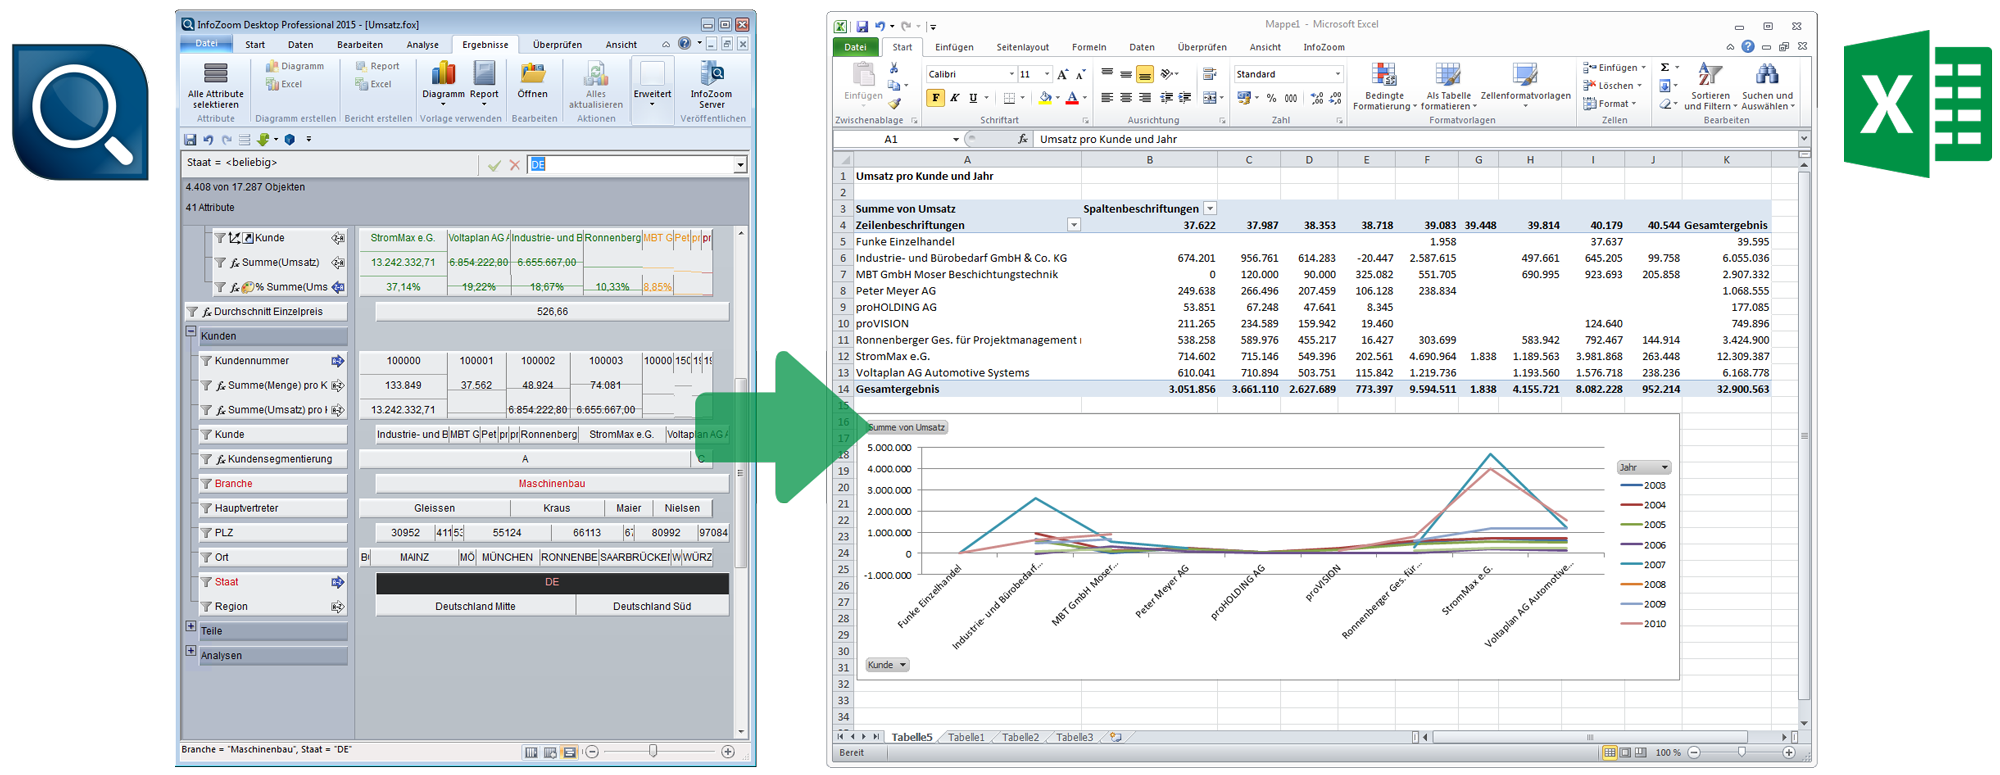
export your results to Excel with one click
If required, you can transfer your results to Excel with one click. Other well-known export formats allow you to easily take your data to other tools.
List & Label component:
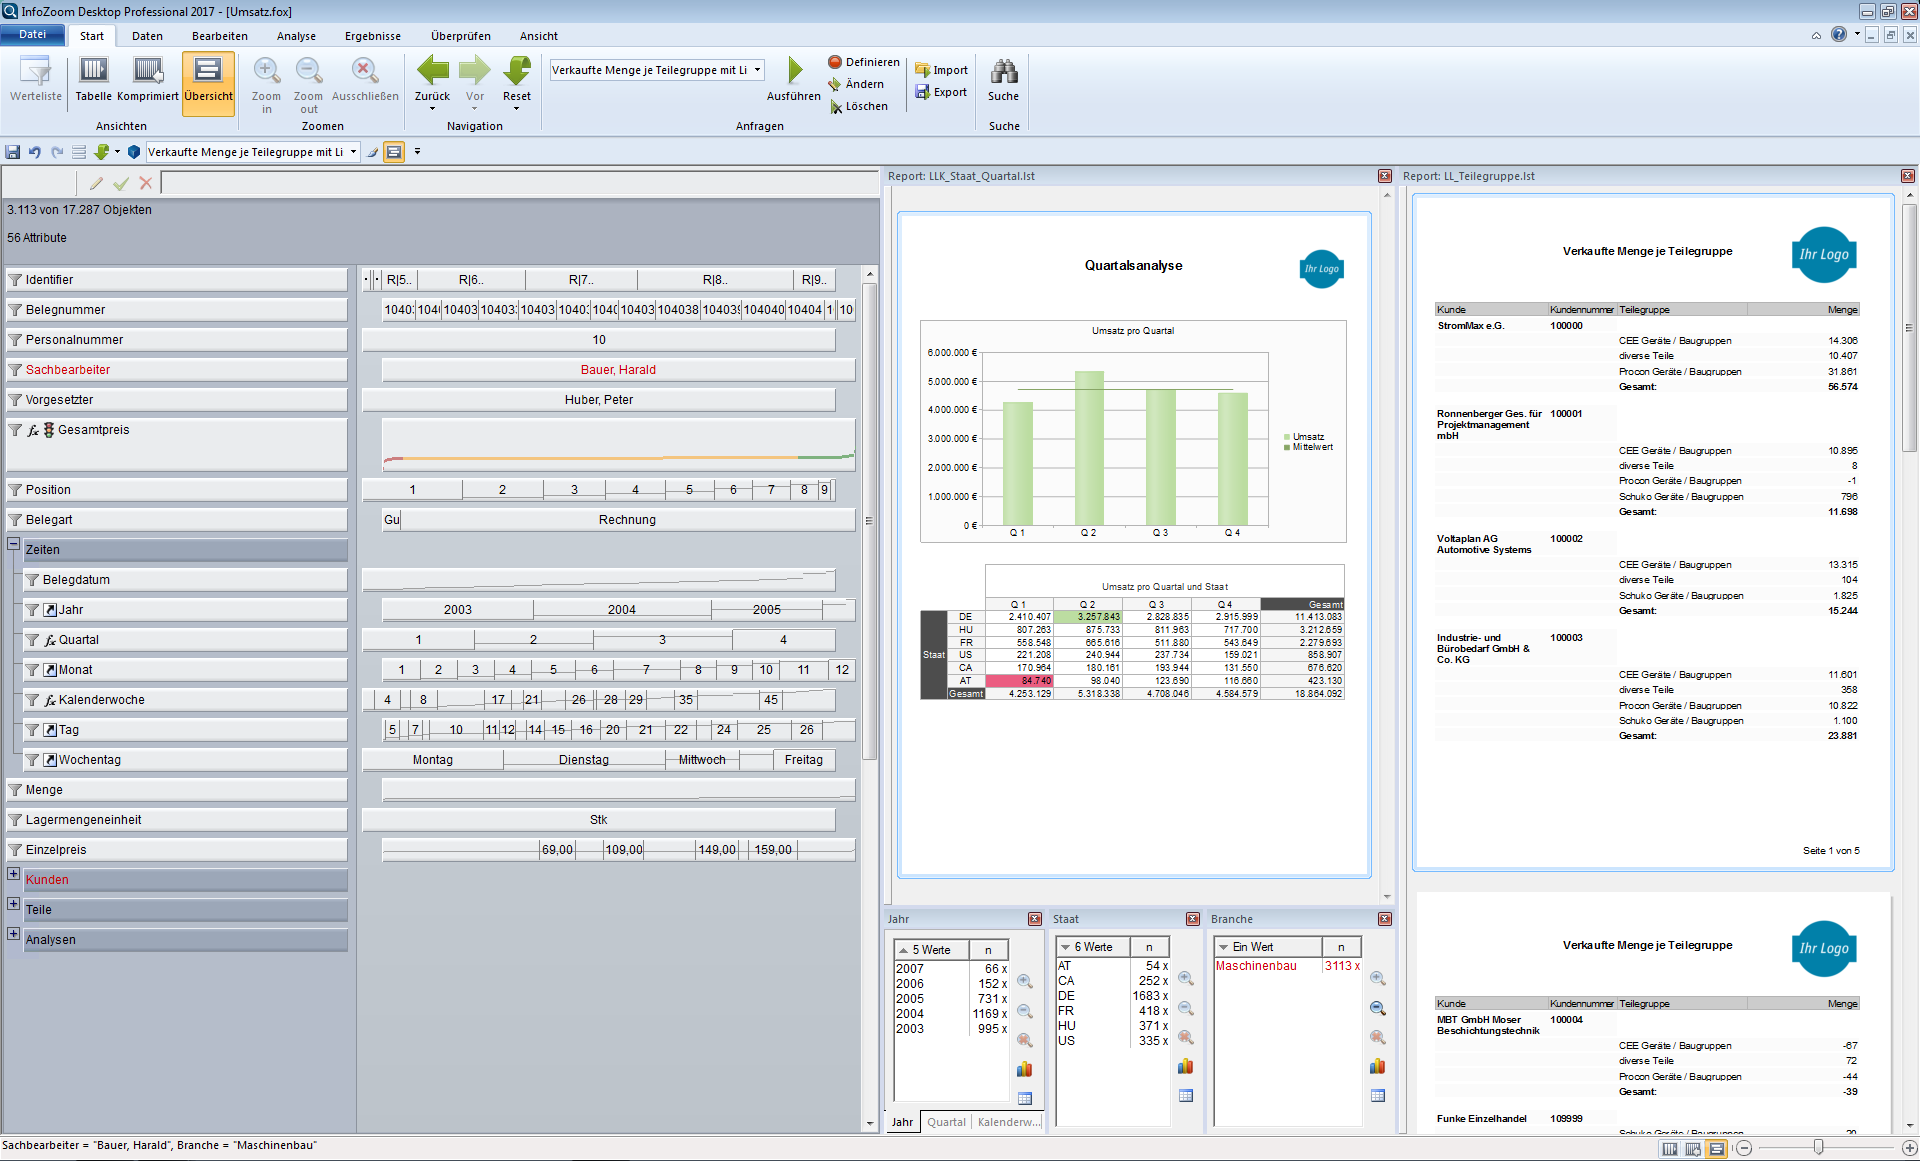
advanced reporting options
Charts, standard letters, graphics, HTML, gauges, barcodes, labels, etc. – enter into a whole new reporting world with List & Label. Anything is possible! There are no limits to your creativity! You can apply your corporate design to reporting. Thanks to dynamic linking, your List & Label reports are adjusted immediately to any changes in the selection.
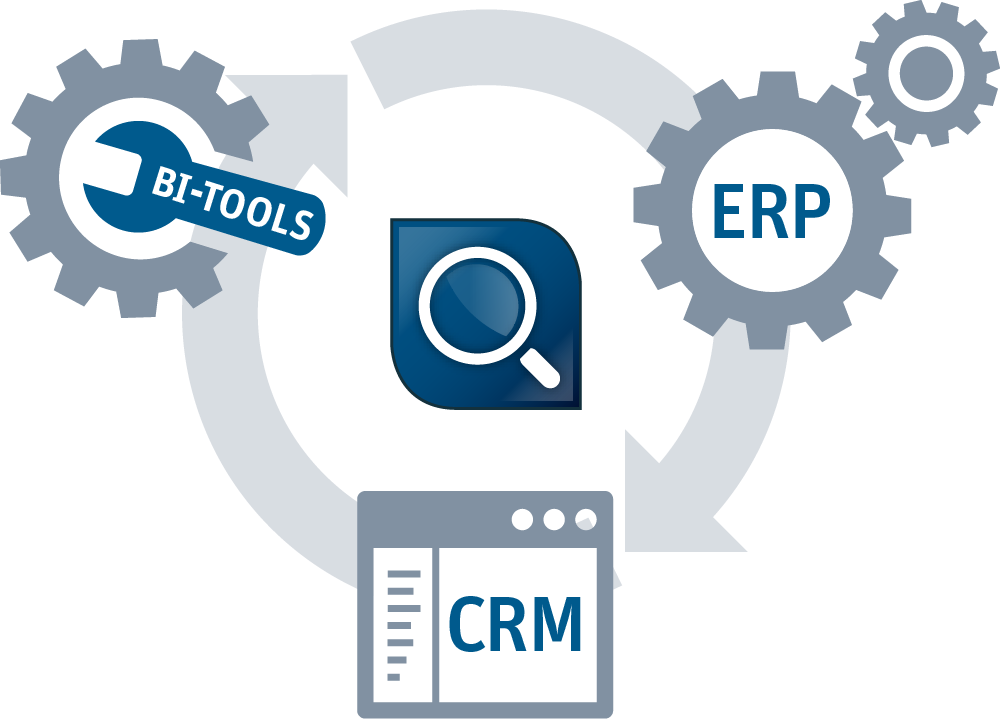
The optimal supplement to ERP, CRM and BI solutions in almost every industry
The tool supplements existing systems in the fields of ad-hoc data analyses and agile data quality management. It’s the Swiss army knife among the data analysis tools.



Ad-hoc analyses
with InfoZoom –
always ahead of time
In day-to-day business, there are often spontaneous questions for which you want to create an evaluation immediately. How to get those figures quickly? InfoZoom allows you to create any evaluation with just a few clicks and helps you find weak points in almost no time.
Data are the ground you stand on – have you got a good foothold?
Have you ever thought about what poor data quality really costs you? We can tell you as much as this: way more than our tool! Your decisions are based on KPIs. But how can you know they are correct? With InfoZoom you create reliable analyses.
Data Profiling – A picture is worth a thousand words: What’s in your data?
Look and see: clarity and transparency at last. Users get a whole new perspective on their data. There is no other tool that facilitates interpreting and modeling data like InfoZoom does. New constellations between data can be revealed with just a few clicks.
InfoZoom Data Quality –
your way to sustainable
clean data
Data quality is a continuous process. It is not sufficient to clean the data just once. With IZDQ, you can monitor the quality of your data continuously and automatically. This function is based on a highly flexible and demand-oriented set of rules that automatically detects errors.
What can we do for you?
Consulting – let’s investigate your data together.
Consulting – let’s investigate your data together.
You want to restructure your reporting? You want to get a picture of your data basis? You’re about to launch a DQ project? There’s a bit of a problem somewhere? Practice makes perfect – our experienced consulting team will be happy to support you in any phase of your data project.

Answer questions spontaneously and reliably – discover the advantages of InfoZoom
Reliable data analyses that meet the requirements of your everyday work! No other tool makes it easier to interpret and understand data at the push of a button.


